
People.ai
AI Deal Review Dashboard
Role: Lead Product Designer, UX Researcher
Duration: 3 months
Tools: Figma
System: Web App
Empowering enterprise sales teams with predictive AI insights for better forecasting and faster pipeline decisions.
I led the end-to-end UX for a predictive, AI-powered dashboard designed to help sales teams quickly surface deal risks and take action. In a landscape where fragmented tools and unclear signals slowed decisions, the design unified key insights into a clear, trustworthy interface, enabling faster, more confident pipeline reviews.

Challenge & Users
The Problem:
There was no reliable way to assess pipeline health at scale. CRM data was fragmented, self-reported, and often misleading. As a result:
Sales managers and leaders couldn’t confidently predict outcomes.
Sales reps lacked guidance on how to advance deals.
Forecast meetings became inefficient, repetitive, and reactive.
The User Personas:

Key Insights
Through user interviews, workflow shadowing, and cross-functional discovery workshops, I identified four key insights across the sales process:
Unclear Deal Health
Sales reps marked deals as "on track" despite no recent engagement or missing key signals.
No Guided Action
Sales reps didn’t know what to do next: no system-level nudges or insights.
Fractured Tooling
Managers had to piece together information from multiple sources during forecast review calls.
No Accountability Loop
No way to follow through on suggested actions or coach effectively.
Proposed User Journey
The redesigned experience creates a more intuitive and focused workflow. By consolidating critical deal information into one place, surfacing clear, trustworthy indicators of deal health, and embedding follow-up tasks directly into the interface, the system supports faster, more confident decision-making and stronger accountability across teams.
This directly supports the needs of each user group:
Sales Managers gain quick visibility into at-risk deals and stronger forecasting confidence.
Sales Operations Managers get centralized tools to monitor seller activities.
Sales Reps receive timely guidance on which deals to prioritize and what steps to take.

Design Principles Applied
To shape a dashboard that builds confidence and accelerates decisions, I grounded the design in three guiding principles. Each was validated through user research and directly shaped interaction, content, and layout decisions.
North Star: Unify fragmented information into a single source of truth.
The goal: surface reliable, explainable AI signals that help managers coach, not chase.
Clarity Over Complexity - Don’t show the AI model. Show what matters.
Explain the Why - Provide rationale for every insight to build trust.
Simple By Design, Power On Demand - Progressively disclose details
Key Features
Deal Health Snapshot
Simple health status: Healthy / At Risk / Needs Attention
AI-driven signals summarized into one visual
Color-coded risk tags like "Gone Silent" or "Missing Decision-Maker"
Helped triage deals in 1:1s instantly

Insight Cards with Rationale
Paired each AI insight with the "why"
e.g. "No engagement from decision-maker in 14 days"

Validation & Iteration
I explored several key concepts in early sketches to find UX opportunities and to ensure I was showing the most important information at the right level. My learnings from testing these concepts with users led me to my final design solution.
Filtering & Prioritization of deals

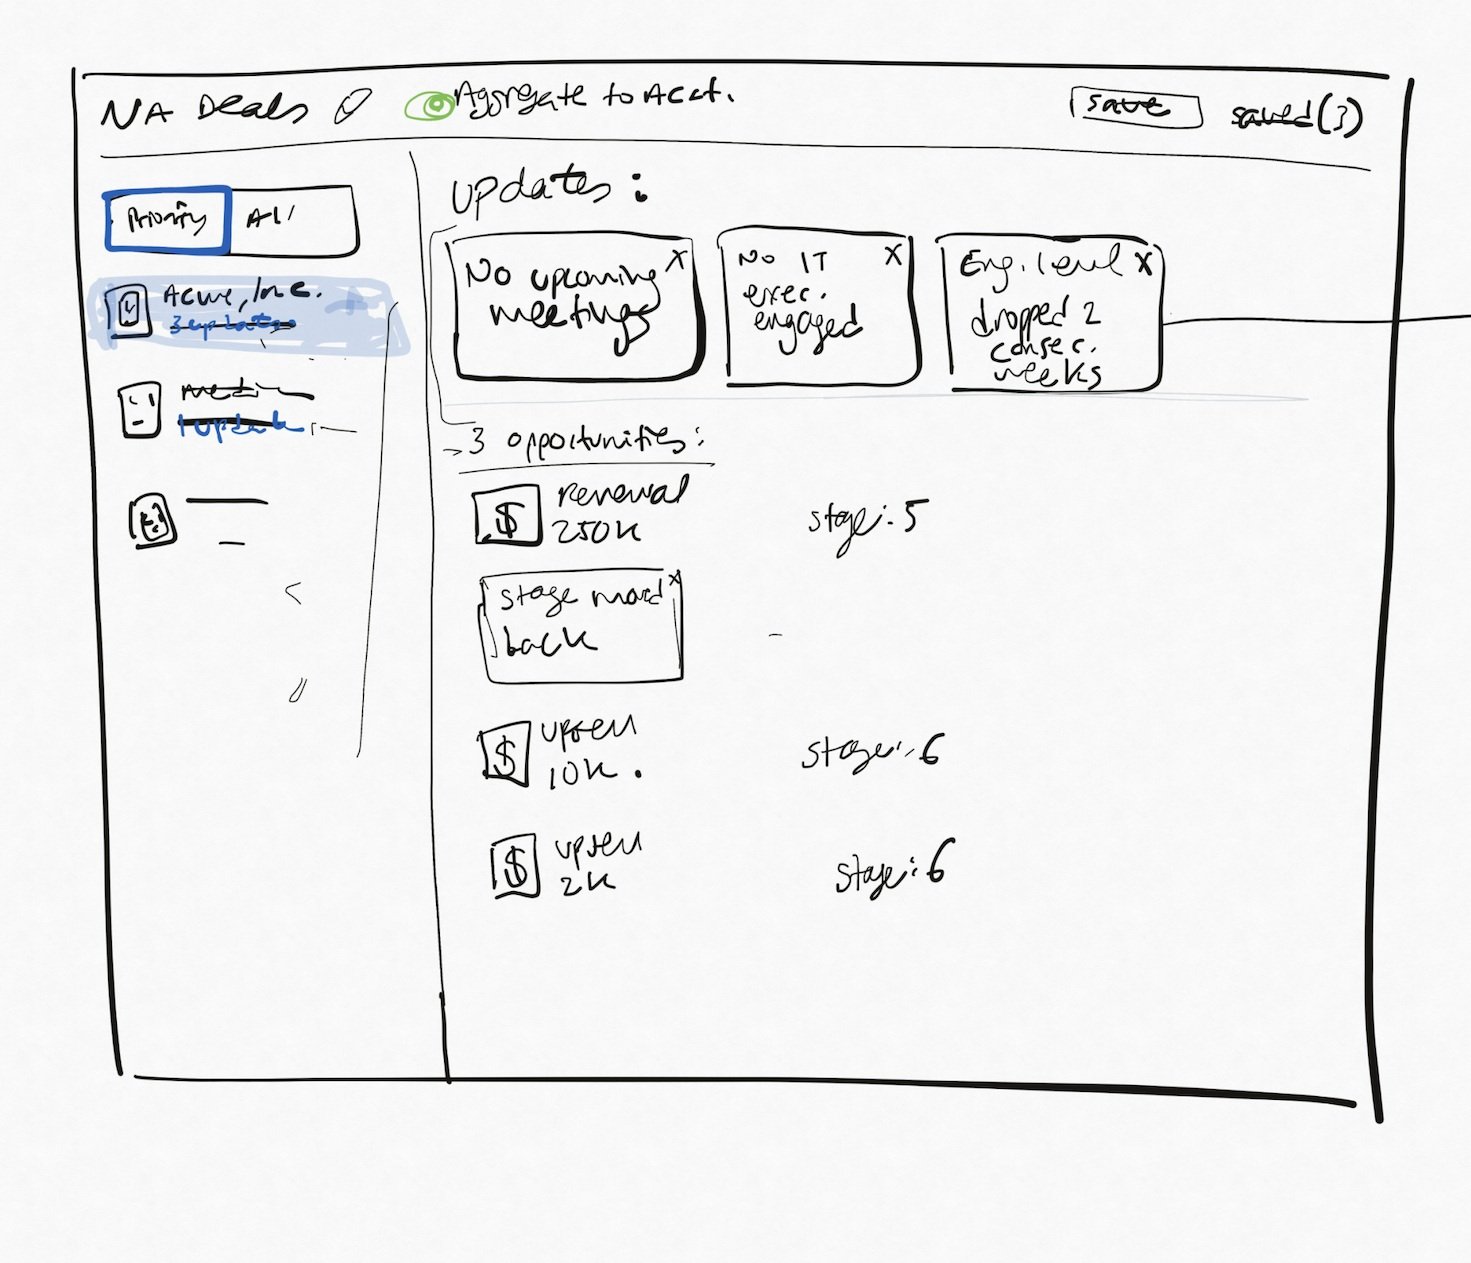

Insight Display & Placement


Insight Explainability & Coaching Triggers


Impact
Insight Trust:
80%+ adoption of AI recommendations within 6 weeks
Upsell Opportunities:
This feature created major upsell opportunities for the company due to the positive feedback received from customers.
What I’d Do Next
Add real-time collaboration features for forecast prep
Incorporate AI-based coaching recommendations based on rep behavior
Layer in confidence scores or thresholds for AI predictions